This notebook analyzes the performance trends in the men’s and women’s 100-meter and 200-meter dash in the Summer Olympic Games. The goal is to understand:
- How fast each medalists’ time is compared to the model’s expected result for that Olympic year
- Which medalist overperformed their expected result the most compared to all other competitors in the same event
- To predict the expected result for Gold, Silver, and Bronze in the 2024 Olympic Games 100-meter and 200-meter dash
This notebook was forked and based on Omri Goldstein’s work on Kaggle. The updates to his notebook are the following:
- Added results from the Summer 2020 Olympic Games
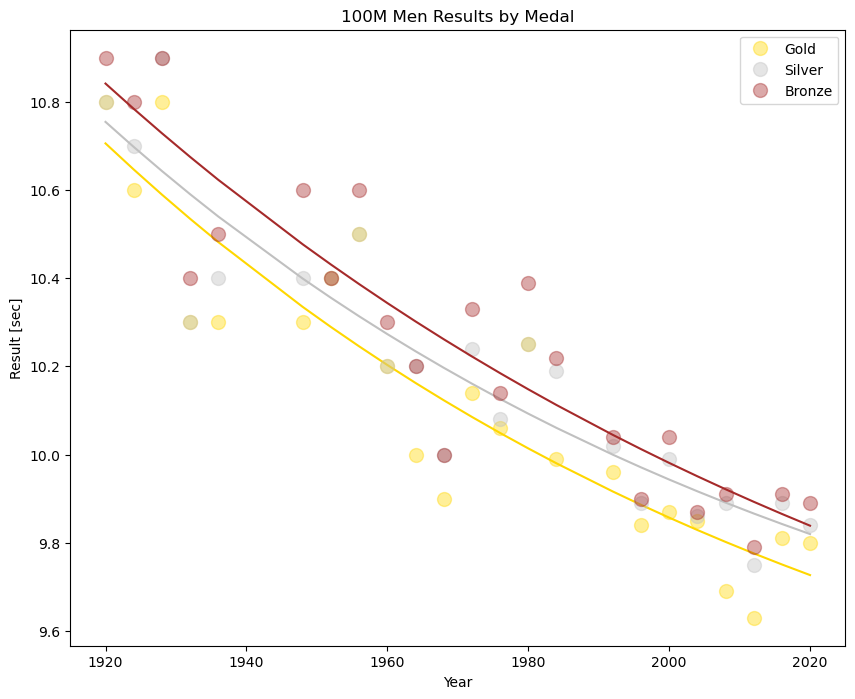
- Plotted the data and fitted an exponential curve for each medal
- Removed outlier results from early Summer Olympic Games to better fit model
- Predicted the results for the 2024 men’s and women’s 100-meter and 200-meter dash
For a more detailed analysis of this project, you can read my blog post on Medium.
—
data/                 # cleaned results file (results_updated.csv)
notebooks/            # main analysis notebook
reports/
   figures/           # exported PNGs used in the README
src/                  # optional helper scripts
requirements.txt      # dependencies
README.md             # project documentation
pip install -r requirements.txt
jupyter notebook notebooks/ahead_of_their_time_2024.ipynb- Source: Based on and extended from Omri Goldstein’s Kaggle dataset
- File:
data/results_updated.csv - Fields include:
- Athlete name
- Country
- Event (100m, 200m)
- Gender
- Olympic year
- Medal
- Final time (seconds)
- Cleaned and extended original results dataset
- Removed early-era outliers and incomplete records
- Fit exponential regression curves for each event
- Computed residuals to identify athletes significantly outperforming the era trend
- Predicted medal-winning times for 2024
- Visualized trends and overperformers
- Sprint performance improves exponentially but has slowed in recent decades
- Certain athletes were dramatically ahead of the curve (especially early years)
- Predicted 2024 medal times using fitted trend lines
- (Optional future update) Compare predictions to actual 2024 results

pandas>=2.1
numpy>=1.26
matplotlib>=3.8
scipy>=1.11
seaborn>=0.13
- Add 2024 actual results to validate predictions
- Add helper functions to
src/for curve fitting and residual analysis - Extend to 400m or relay events
- Show uncertainty intervals for model predictions
Last updated: 2025-11-14
Leave a Reply